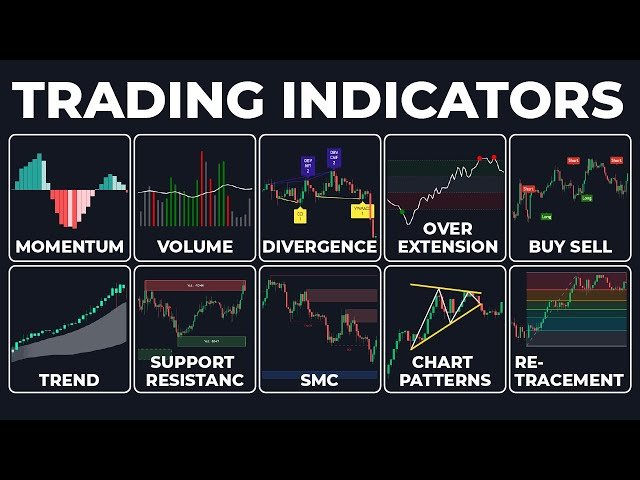
Trade Indicators: Your Ultimate Guide to Smart Trading Decisions
In the fast-paced world of financial markets, having a reliable strategy to interpret market movements is crucial. This is where trade indicators come into play. These powerful tools help traders make informed decisions based on data and trends rather than emotion or speculation. Whether you’re a beginner or a seasoned investor, understanding trade indicators is essential for navigating today’s dynamic markets.
Trade indicators, also known as technical indicators, are mathematical calculations based on the price, volume, or open interest of a security. Traders use these indicators to forecast potential future price movements. Unlike fundamental analysis, which focuses on a company’s financial health or economic conditions, trade indicators focus strictly on market activity—making them ideal tools for short-term trading and trend spotting.

Indicators offer a data-driven approach to decision-making. They help identify entry and exit points, trends, momentum, and potential reversals in market direction. This makes them invaluable for:
- Minimizing emotional trading
- Supporting more consistent strategies
- Enhancing timing for trades
- Gaining a deeper understanding of market behavior
In markets like forex and commodities, where price volatility is high and trends can change quickly, trade indicators provide traders with a structured way to analyze and act.
Types of Trade Indicators
There are two primary categories of trade indicators:
1. Overlays
These indicators are plotted over the asset’s price on a chart and use the same scale. Common examples include:
- Moving Averages (MA): These smooth out price action to identify trends.
- Bollinger Bands: These bands measure volatility and are helpful in spotting overbought or oversold conditions.
2. Oscillators
Oscillators move between fixed values and are plotted above or below the price chart. They help determine market momentum and potential reversal points. Examples include:
- Relative Strength Index (RSI): Measures the magnitude of recent price changes to evaluate overbought or oversold conditions.
- Moving Average Convergence Divergence (MACD): Analyzes the relationship between two moving averages to detect trend direction and momentum.
- Stochastic Oscillator: Compares a particular closing price of an asset to a range of its prices over time.
How Trade Indicators Work in Real Markets
Let’s say you’re trading a popular currency pair like EUR/USD. By using RSI, you may find that the pair is currently oversold—potentially signaling a buying opportunity. Add in a confirmation from MACD showing a bullish crossover, and you now have multiple indicators supporting a potential upward move.
This layered approach improves decision-making and reduces reliance on guesswork.
Technical vs. Fundamental Analysis
While technical indicators rely on past price data and patterns, fundamental analysis considers economic reports, interest rates, political developments, and company earnings. Many traders combine both methods to create a balanced view of the market. However, for short-term strategies and fast-moving markets, trade indicators often provide quicker signals.
Key Trade Indicators Every Trader Should Know
Moving Averages (MA)
Moving averages help identify the direction of the trend over a specific period.
- Simple Moving Average (SMA): A basic average over a period of time.
- Exponential Moving Average (EMA): Gives more weight to recent prices, making it more responsive.
Relative Strength Index (RSI)
RSI values range from 0 to 100. A value above 70 might indicate that the asset is overbought, while a value below 30 may indicate it’s oversold.
MACD (Moving Average Convergence Divergence)
MACD helps identify changes in momentum and potential trend reversals. The indicator consists of two moving averages (MACD line and signal line) and a histogram.
Bollinger Bands
These are composed of a middle band (usually a 20-day SMA) and two outer bands set two standard deviations above and below. When the price moves near the upper band, it may be overbought; near the lower band, it may be oversold.
Stochastic Oscillator
This indicator measures momentum and compares a closing price to a price range over time. Values range between 0 and 100, with levels above 80 considered overbought and below 20 oversold.
Combining Trade Indicators for Better Results
Relying on a single indicator can sometimes lead to false signals. That’s why many traders use a combination of trade indicators to validate their analysis. For example:
- RSI + MACD: Confirms both momentum and trend direction.
- Moving Averages + Bollinger Bands: Provides insight into both volatility and direction.
- Stochastic + MACD: Combines momentum with trend confirmation.
Trade Indicators in Forex and CFD Trading
Indicators are especially useful in forex trading and CFD (Contract for Difference) trading due to the high volatility and leverage involved. These markets require quick decision-making and well-timed entries and exits, which trade indicators facilitate.
Platforms like MetaTrader 5 (MT5) allow traders to apply multiple indicators on various timeframes, enhancing analysis and allowing for automated trading strategies using Expert Advisors (EAs).
Using Trade Indicators Effectively
To maximize the benefits of trade indicators:
- Avoid overloading your charts with too many indicators.
- Understand each indicator’s strengths and limitations.
- Test your strategies using demo accounts.
- Combine with sound risk management practices.
Final Thoughts: Mastering the Art of Trade Indicators
Indicators are essential tools that help traders cut through the noise and focus on meaningful data. While no indicator can predict the future with certainty, using a combination of these tools can significantly enhance your trading strategy.
Whether you’re trading forex, stocks, or CFDs, integrating trade indicators into your analysis can lead to more strategic and informed decision-making. Make sure to continue learning and adapt your approach to the ever-changing market conditions.
Signal Expert Global brings you insightful resources to elevate your trading journey. Stay informed, stay smart, and make your moves with confidence.
